
Industrial — Solar + Procurement
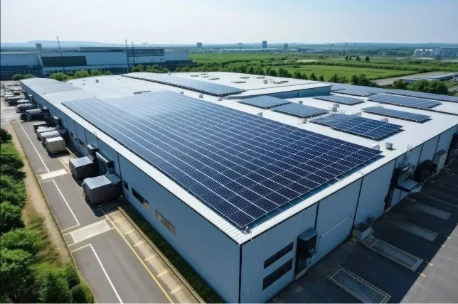
Rooftop solar paired with portfolio energy procurement for a manufacturing and distribution operation, with the on-site assets earning in a grid market between production peaks.
Three separate streams, only one of which shows up on the utility bill.
Solar and procurement projects are usually pitched on bill savings alone. That understates them. The figures below are modeled across a 30-year term and are kept apart deliberately, because each one behaves differently — one reduces what you are billed, one pays you directly, and one arrives as capital against the installed cost.
Capacity and transmission savings
Capacity and transmission charges are set by the facility's demand during a small number of measured intervals each year. Generating and discharging through those intervals lowers the demand the utility records, and therefore the charges assessed for the entire period that follows. The saving appears as a smaller bill rather than as a payment.
Frequency regulation income
Outside of production peaks the same assets hold capacity available to the grid operator and respond to second-by-second frequency signals. That service is compensated as market revenue, paid to the operator independently of anything happening on its utility account. It is the largest of the three streams and the one most often left out of a vendor's model.
Incentives captured
Federal, state, and utility program incentives applied against the project. Eligibility, stacking rules, and application windows differ by territory and change over time, which is why they are established during evaluation rather than assumed at the end.
The sum of the figures above. Savings and market revenue are modeled over the 30-year term; incentive value depends on the programs available at the time of application.
Modeled outcomes, stated as modeled outcomes.
These are modeled results over a 30-year term, built from verified utility data, measured load profiles, and conservative lifecycle assumptions. TEK distinguishes modeled results from realized, verified outcomes as a matter of practice, and this page is the former.
What moves the numbers most is not the equipment. It is the tariff the facility sits on, the market its utility territory belongs to, and how sharply its load peaks against its production schedule. The same array and supply strategy applied at two plants in different states can produce materially different economics, and a frequency regulation market that pays well today may be saturated in a decade — which is why long-horizon models are run with conservative assumptions rather than current-year rates carried forward.
TEK does not manufacture or sell solar equipment. The evaluation that produces figures like these is independent of any single manufacturer or supplier, and where the economics do not justify a project, the recommendation is to not build it.